NO.PZ2020010304000053
问题如下:
A data management group wants to test the null hypothesis that observed data is N(0,1) distributed by evaluating the mean of a set of random draws. However, the actual underlying data is distributed as N(1, 2.25).
a. If the sample size is 10, what is the probability of a Type II error and the power of the test? Assume a 90% confidence level on a two-sided test.
b. How many samples would need to be taken to reduce the probability of a Type II error to less than 1%?
选项:
解释:
a. When the null hypothesis is false, the probability of a Type II error is equal to the probability that the hypothesis fails to be rejected.
Now, if there are 10 samples taken from an N(0,1) then the standard deviation is reduced
Therefore, the cut-off points are
In actuality, the true distribution is N(1,2.25), so the . For a sample size of 10, the expected sample standard deviation is
Calculating the equivalent distance of in this distribution compared to a standard N(0,1) yields
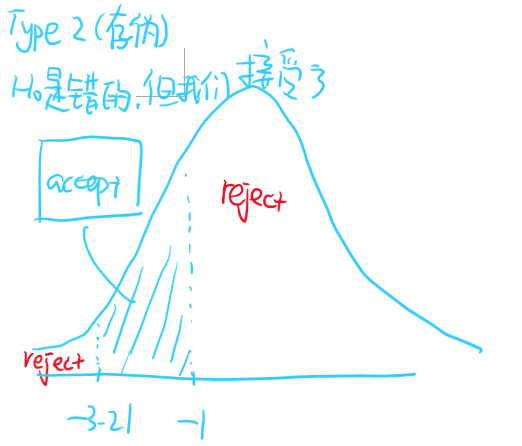
left = (-0.522-1)/0.474=-3.21
and right =(+0.522 - 1)/ 0.474 = -1.00
The probability of being on the left-hand side is practically zero. For the right, Pr(> right) = 1 - Φ(-1.00) = 1 - 15.9% = 84.1%.
So total probability of a Type II error is 1 – the probability of being in the two tails is
Pr(Non - Rejection|Ho is false) = 1 - [Pr(< left) + Pr(> right)] ≈ 1 - 84.1% = 15.9%
Therefore, the power of the test is 84.1%.
b. The requirement is to have 1 - [Pr(< left) + Pr(> right)] = 1%
Clearly, as n increases from 10, the probability of being in the left-hand tail will only decrease from already being close to zero.
Therefore, the requirement becomes 1 - Pr(> right) = 0.01
This occurs at a Z-score of (using the Excel function NORMSINV) -2.32.
Accordingly, the following equations need to be solved
and
Plugging in K yields:
And because partial observations are not allowed, n = 27.
我自己画了一个图,超过尺寸无法上穿。老师可不可以画个图帮助理解一下这道题。
我理解的是,原本以为这是正态分布,后来发现不是,那就看标准正态分布在N(1,2.25)的位置在哪里。计算后发现在-1和-3.21之间,那么type2error是取伪的概率,就看-1和-3.21之间的概率就可以了。


