NO.PZ201512020300000902
问题如下:
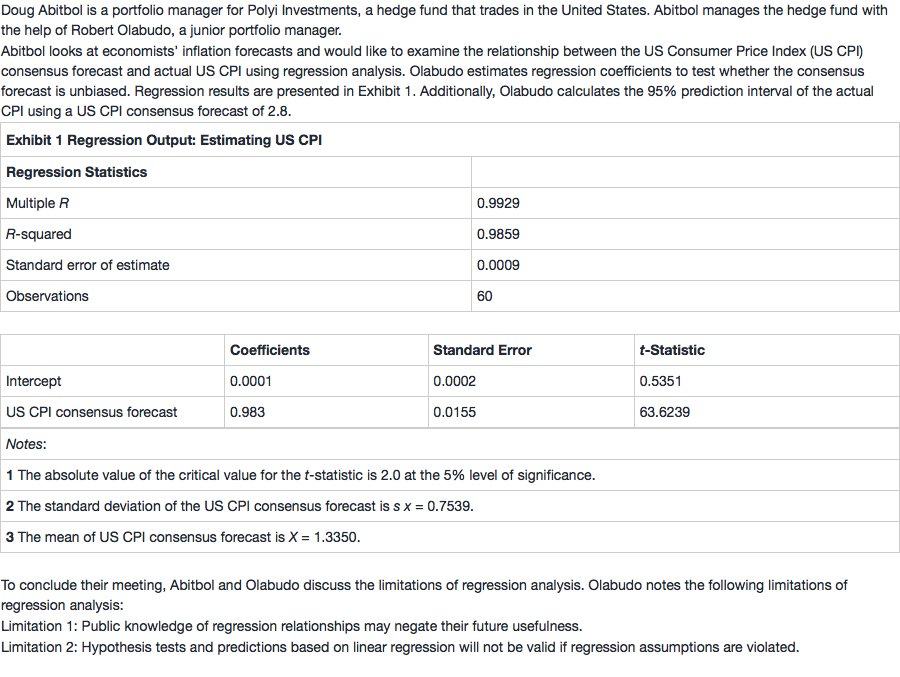
Based on Exhibit 1, Olabudo should calculate a prediction interval for the actual US CPI closest to:
选项:
A.2.7506 to 2.7544
B.2.7521 to 2.7529
C.2.7981 to 2.8019.
解释:
A is correct. The prediction interval for inflation is calculated in three steps:
Step 1 – Make the prediction given the US CPI forecast of 2.8:
Y=b0+b1X=0.0001+(0.9830×2.8)=2.7525
Step 2 – Compute the variance of the prediction error:
sf2=s2[1+n1+(n−1)×sx2(X−X)2]
sf2=0.00092[1+601+(60−1)×0.75392(2.8−1.3350)2]=0.00000088
sf=0.0009
Step 3 – Compute the prediction interval:
Y±tc×sf
2.7525±(2.0×0.0009)
2.7525–(2.0×0.0009)=2.7506; lower bound
2.7525+(2.0×0.0009)=2.7544; upper bound
So, given the US CPI forecast of 2.8, the 95% prediction interval is 2.7506 to 2.7544.
为什么不可以用文中表格给出的standard error


