问题如下:
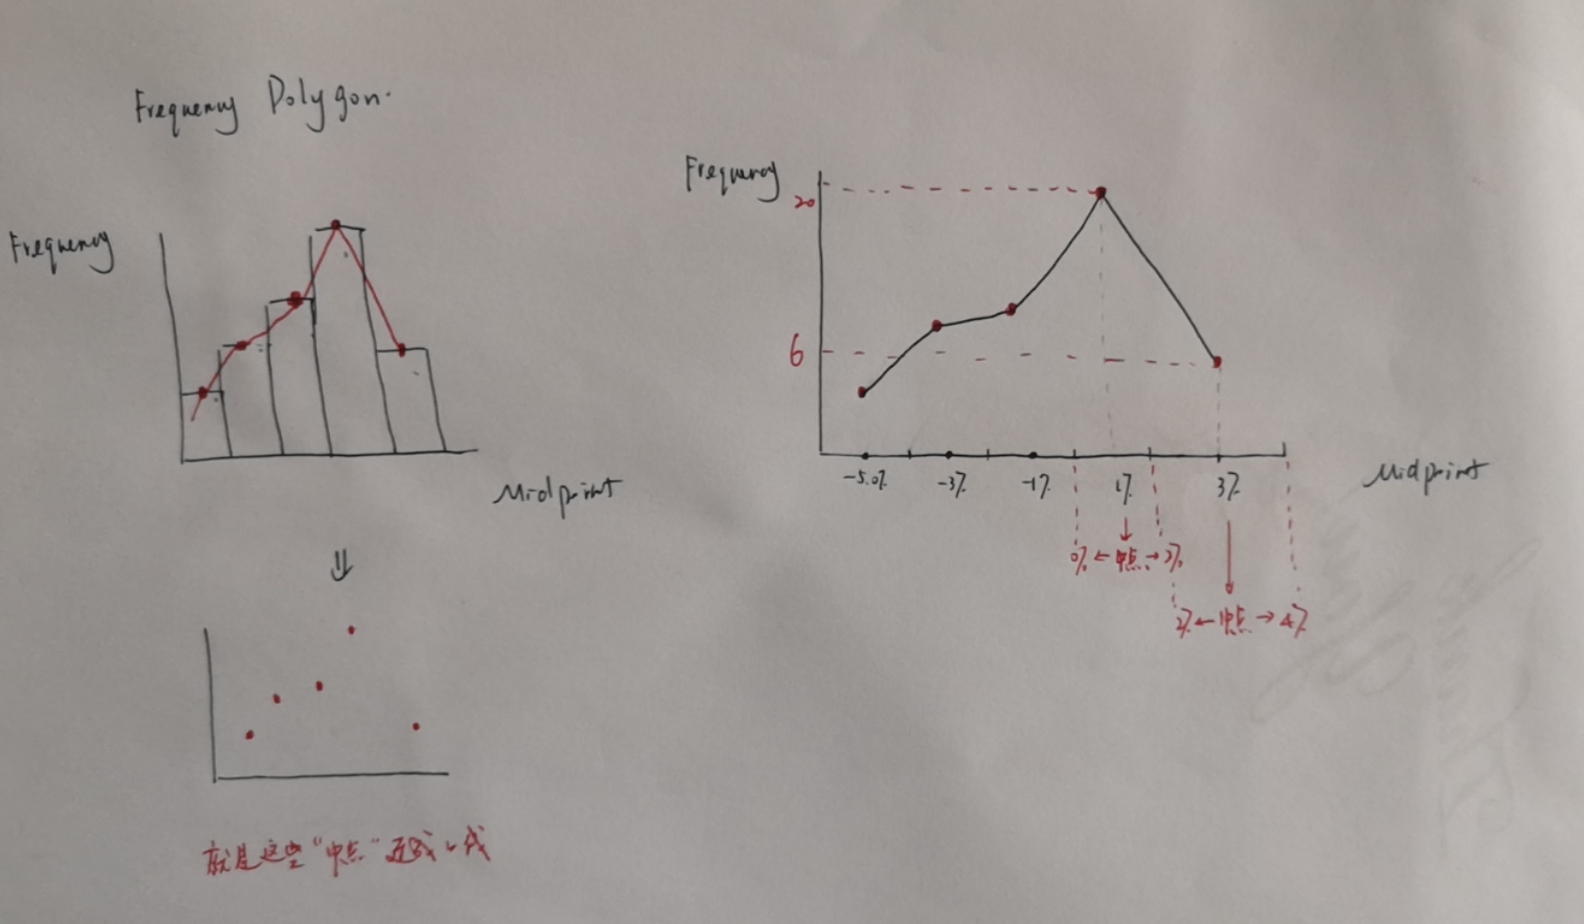
The following is a frequency polygon of monthly exchange rate changes in the US dollar/Japanese yen spot exchange rate from January 2010 to December 2013. A positive change represents yen appreciation (the yen buys more dollars), and a negative change represents yen depreciation (the yen buys fewer dollars)

Based on the chart, yen appreciation:
选项:
A.occurred more than 50% of the time.
B.was less frequent than yen depreciation.
C.in the 0.0 to 2.0 interval occurred 20% of the time.
解释:
A is correct.
Twenty observations lie in the interval "0.0 to 2.0," and six observations lie in the 2.0 to 4.0 interval. Together, they represent 26/48, or 54.17% of all observations, which is more than 50%.
不是很理解“这两段区间一共对应的是0%-4%。,其中1%的那段,对应纵轴频率是20;3%那段对应的频率是6。”这段话。
Twenty observations lie in the interval "0.0 to 2.0," and six observations lie in the 2.0 to 4.0 interval. Together, they represent 26/48, or 54.17% of all observations, which is more than 50%.
请问这道题究竟考得是什么呢?
升值区域是从0%~4% 我可以理解。0~2% 对应的是20,是只能看最高值mode对吗?3~4%mode是6?