NO.PZ2023091601000092
问题如下:
Consider a stock that pays no
dividends, has a volatility of 25% per annum and an expected return of 13% per
annum. Suppose that the current share price of the stock, S0, is USD 30. You
decide to model the stock price behavior using a discrete-time version of geometric
Brownian motion and to simulate paths of the stock price using Monte Carlo
simulation. Let Δt denote the time interval used and let St denote the stock
price at time interval t. So, according to your model,, whereεis a standard
normal variable.
To implement this
simulation, you generate a path of the stock price by starting at t = 0,
generating a sample for ε updating the stock price according to the model,
incrementing t by 1, and repeating this process until the end of the horizon is
reached. Which of the following strategies for generating a sample forεwill implement
this simulation properly?
选项:
A.
Generate a sample
for ε by using the inverse of the standard normal cumulative distribution of a
sample value drawn from a uniform distribution between 0 and 1.
B.
Generate a sample
for ε by sampling from a normal distribution with mean 0.13 and standard
deviation 0.25.
C.
Generate a sample
for ε by using the inverse of the standard normal cumulative distribution of a
sample value drawn from a uniform distribution between 0 and 1. Use Cholesky
decomposition to correlate this sample with the sample from the previous time
interval.
D.
Generate a sample
for ε by sampling from a normal distribution with mean 0.13 and standard
deviation 0.25. Use Cholesky decomposition to correlate this sample with the
sample from the previous time interval.
解释:
Monte Carlo
Simulation assumes independence across time so there is no need to correlate
samples from time period to time period, eliminating c and d. Choice a
describes a valid method for generating a sample from a standard normal
distribution.
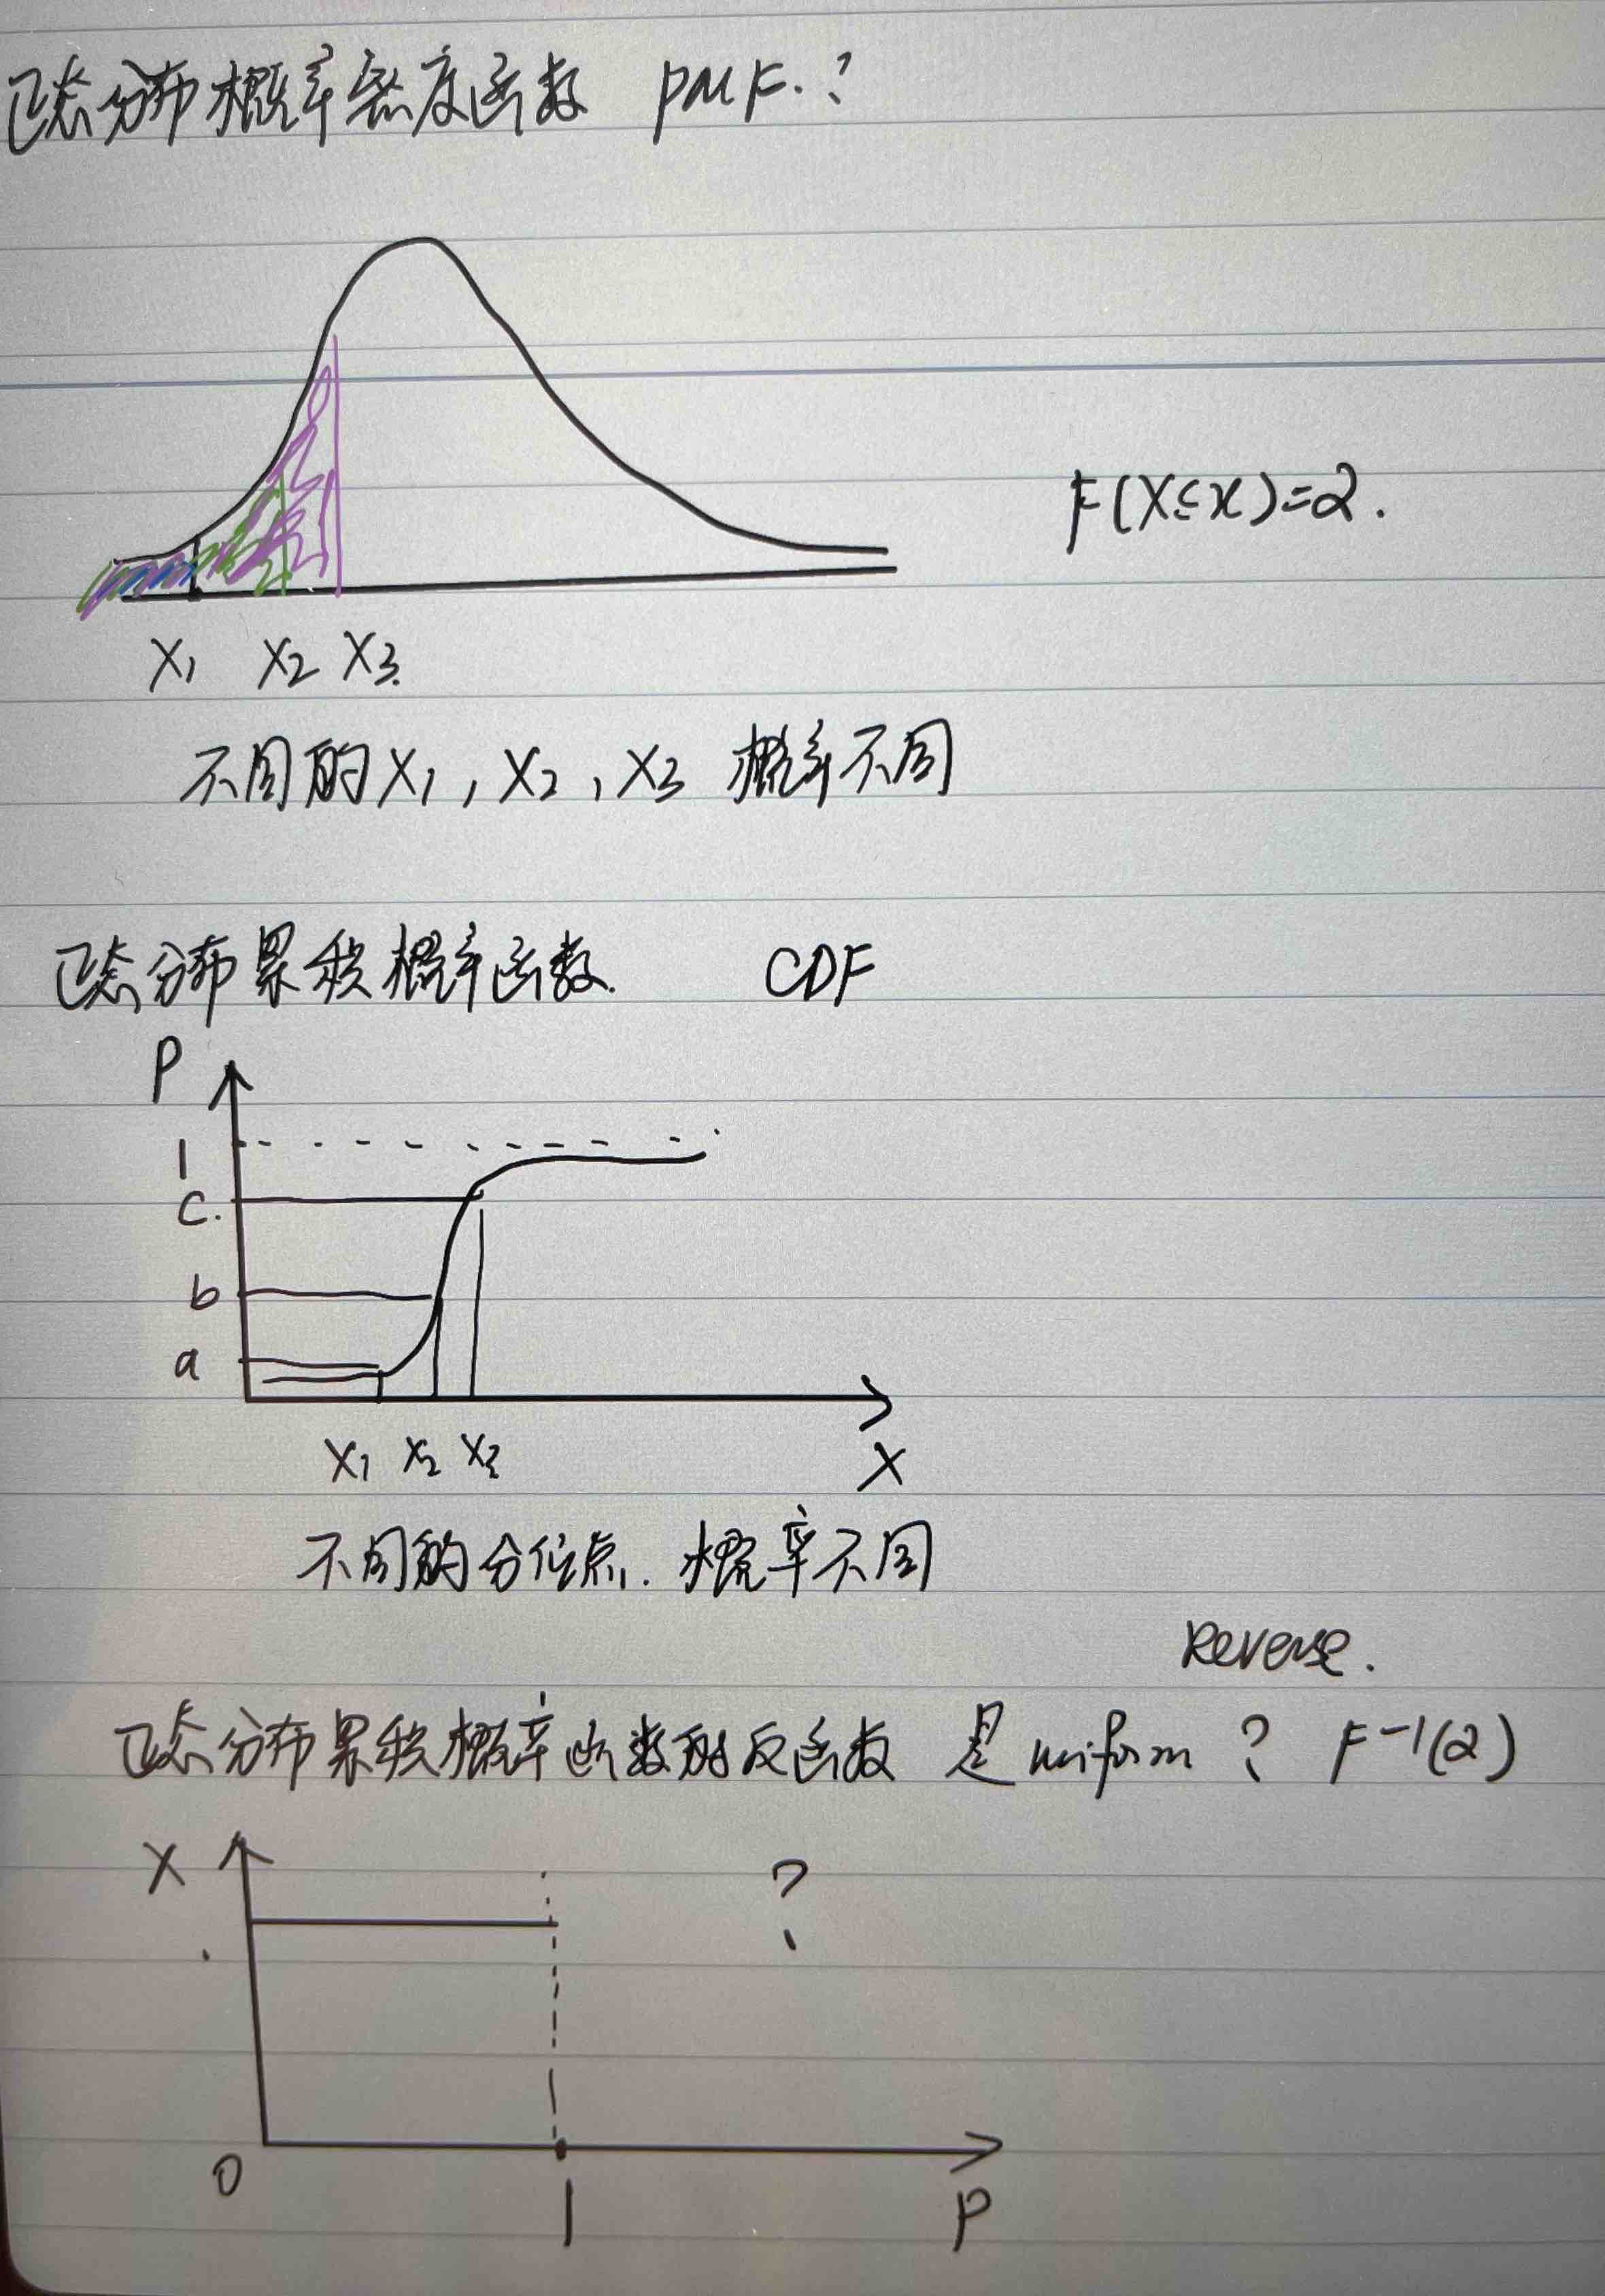
“因为正态分布的累积概率取值范围0-1,并且正态分布每一个分位点取到的概率是相同的,正态分布累积概率的反函数是0-1的均匀分布。”正态分布每一个分位点切割的面积是不同的,也就是概率应该是不同的呀?

您看我画的图对吗?是您解释的意思吗?


