NO.PZ2024042601000065
问题如下:
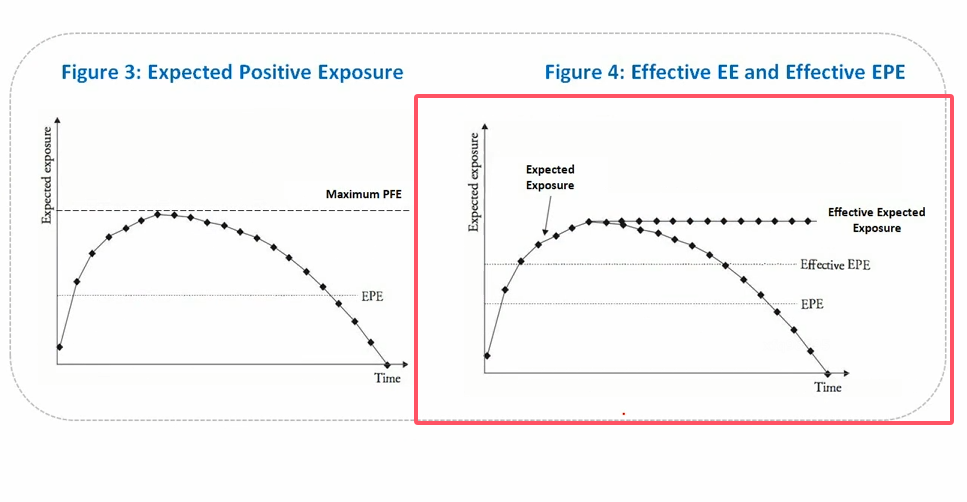
Refer to the chart below, which plots four lines over time.
Which of the following does the uppermost line most likely represent?
选项:
A.
Effective expected exposure
B.
Expected positive exposure
C.
Potential future exposure
D.
Maximum potential future exposure
解释:
Measures such as EE and EPE may underestimate exposure for short-dated transactions (since capital measurement horizons are typically 1-year) and not capture properly rollover risk (Chapter 3). For these reasons, the terms effective EE and effective EPE were introduced by the Basel Committee on Banking Supervision (2005). Effective EE is simply a non-decreasing EE. Effective EPE is the average of the effective EE.
图形中有颜色的几条线,以及怎么记忆,总是记混了


