NO.PZ2021101401000013
问题如下:
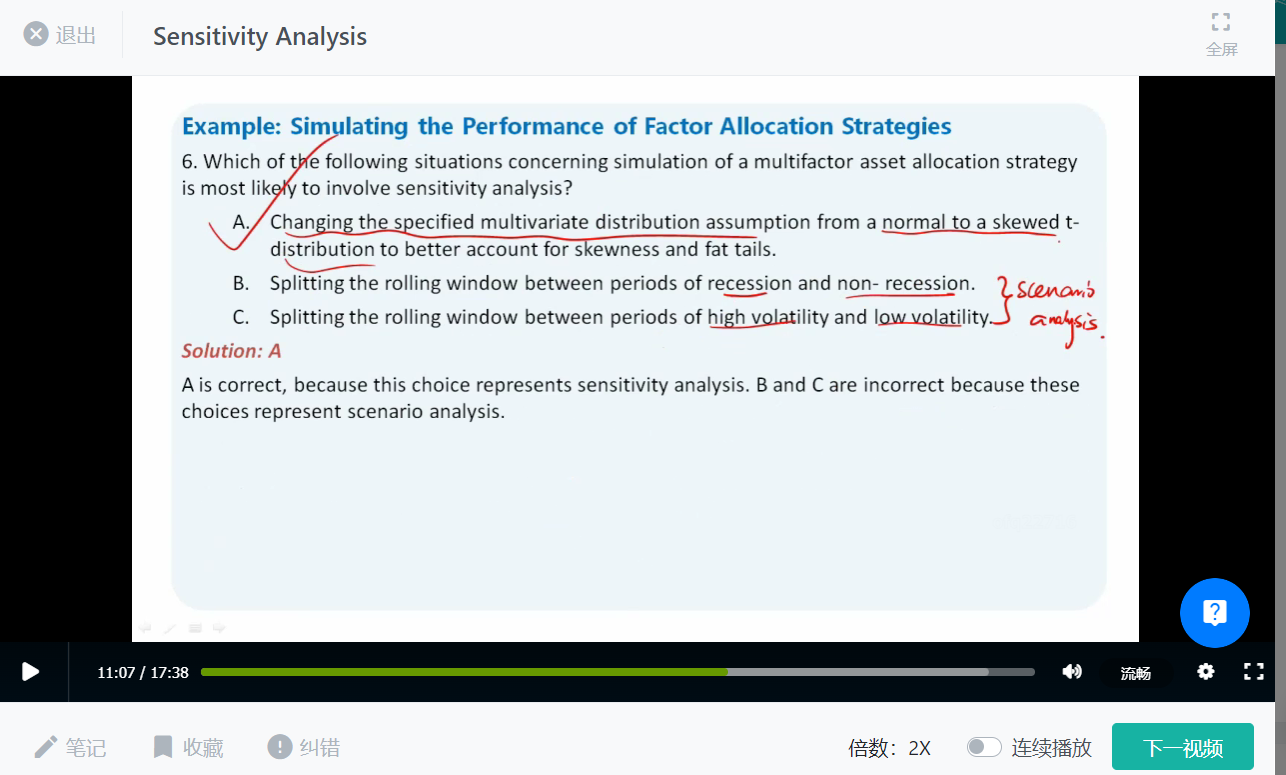
Yuen and Ruckey design a Benchmark Portfolio (A) and a Risk Parity Portfolio (B), and then run two simulation methods (the historical simulation and Monte Carlo simulation) to generate investment performance data based on the underlying nine factor portfolios. For each approach, Yuen and Ruckey run 1,000 trials to obtain 1,000 returns for Portfolios A and B. To help understand the effect of the skewness and excess kurtosis observed in the Factor 1 returns on the performance of Portfolios A and B, Ruckey suggests simulating an additional 1,000 factor returns using a multivariate skewed Student’s t-distribution, then repeating Monte Carlo simulation.
The process Ruckey suggests to better understand how the performance of Portfolios A and B using Monte Carlo simulation is affected by the distribution of Factor 1 returns is best described as:
选项:
A.
data snooping.
B.
sensitivity analysis.
C.
inverse transformation.
解释:
B is correct. Sensitivity analysis can be implemented to help managers understand how the target variable (portfolio returns) and risk profiles are affected by changes in input variables. Approach 2 is a Monte Carlo simulation, and the results depend on whether the multivariate normal distribution is the correct functional form or a reasonable proxy for the true distribution. Because this information is almost never known, sensitivity analysis using a multivariate skewed Student’s t-distribution helps to account for empirical properties such as the skewness and the excess kurtosis observed in the underlying factor return data.
A is incorrect. Data snooping is the subconscious or conscious manipulation of data in a way that produces a statistically significant result (i.e., a p-value that is sufficiently small or a t-statistic that is sufficiently large to indicate statistically significance).
C is incorrect. The inverse transformation method is the process of converting a randomly generated number into a simulated value of a random variable.
从哪里可以看出是敏感性分析


