NO.PZ202208220100000405
问题如下:
The CIO asks you to analyze one of the firm’s portfolios to identify influential outliers that might be skewing regression results of its return drivers. For each observation, you calculate leverage, the studentized residual, and Cook’s D.There are 96 observations and two independent variables (k = 2), and the criticalt-statistic is 2.63 at a 1% significance level. Partial results of your calculations areshown in Exhibit 1.
Finally, you are tasked with investigating whether there is any monthly seasonality in the excess portfolio returns. You construct a regression model using dummy variables for the months; your regression statistics and ANOVA results are shown in Exhibit 2.
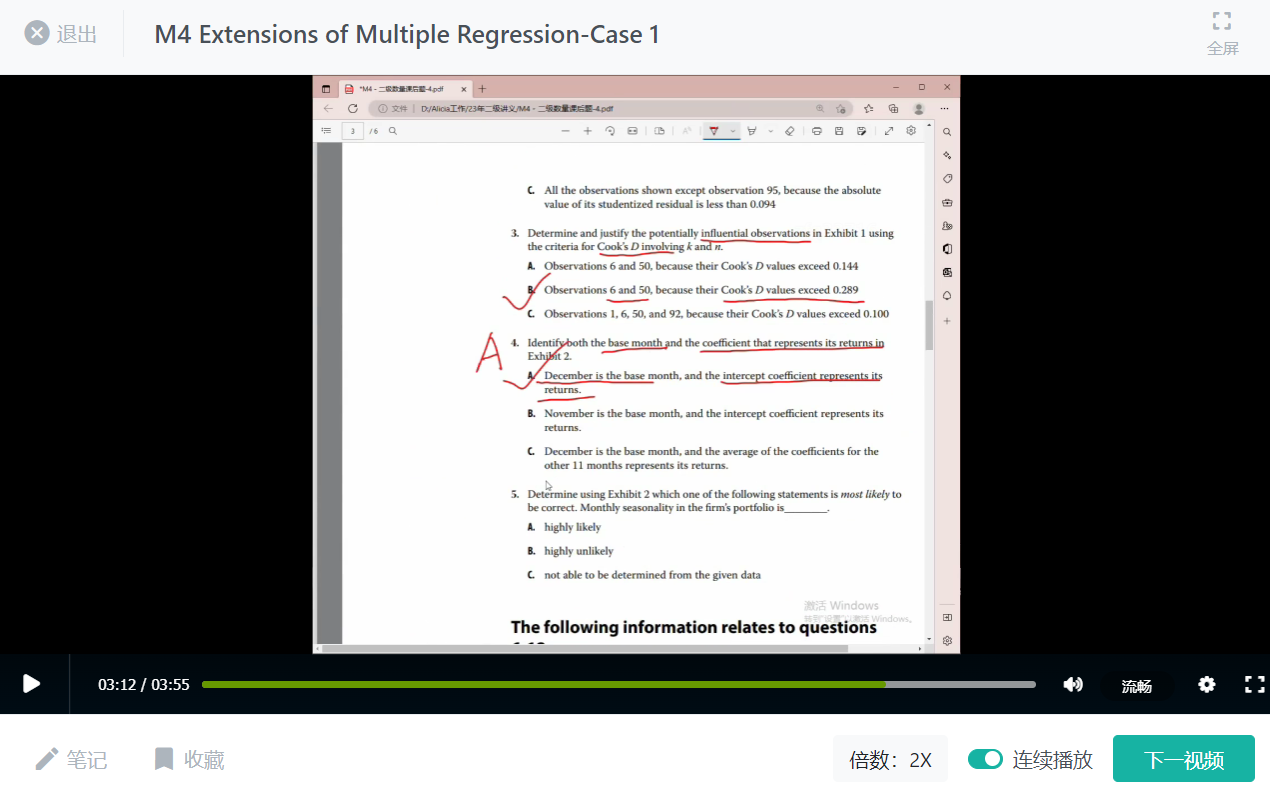
Determine using Exhibit 2 which one of the following statements is most likely to be correct. Monthly seasonality in the firm’s portfolio is________.
选项:
A.highly likely B.highly unlikely C.not able to be determined from the given data解释:
B is correct. Monthly seasonality in the firm’s portfolio is highly unlikely. Thevariance explained by the model (R-squared) is only 10.3%, and after adjusting forthe number of independent variables (adjusted R-squared), it becomes negative.Also, the insignificant F-statistic indicates a 56.3% chance that all variable coefficients are zero. Finally, t-statistics and associated p-values indicate that all thevariable coefficients are insignificant (i.e., not significantly different from zero).Consequently, monthly seasonality is highly unlikely to exist in this portfolio.
请问这道题的讲解视频链接?


