NO.PZ2021061603000018
问题如下:
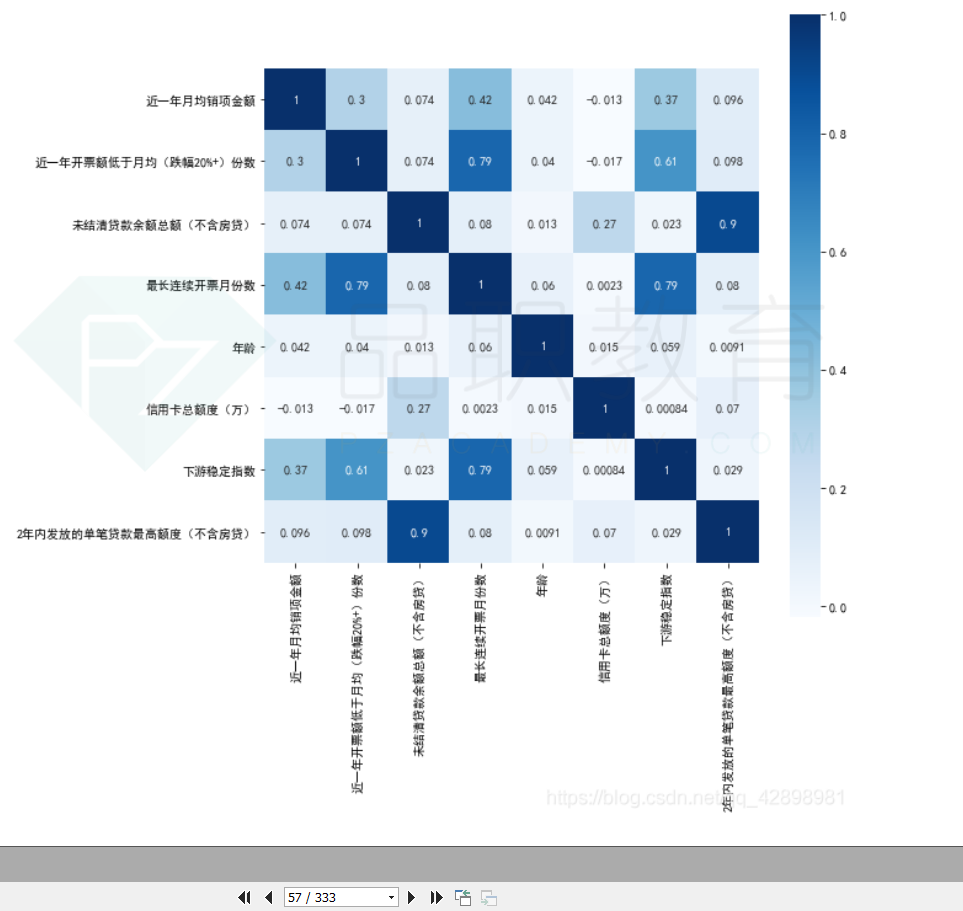
A heat map is best suited for visualizing the:
选项:
A.frequency of textual data. B.degree of correlation between different variables. C.shape, center, and spread of the distribution of numerical data.解释:
B is correct. A heat map is commonly used for visualizing the degree of correlation between different variables. A is incorrect because a word cloud, or tag cloud, not a heat map, is a visual device for representing textual data with the size of each distinct word being proportional to the frequency with which it appears in the given text. C is incorrect because a histogram, not a heat map, depicts the shape, center, and spread of the distribution of numerical data.
如题