NO.PZ2021061603000014
问题如下:
A bar chart that orders categories by frequency in descending order and includes a line displaying cumulative relative frequency is referred to as a:
选项:
A.Pareto Chart.
B.grouped bar chart.
C.frequency polygon.
解释:
A is correct. A bar chart that orders categories by frequency in descending order and includes a line displaying cumulative relative frequency is called a Pareto Chart. A Pareto Chart is used to highlight dominant categories or the most important groups. B is incorrect because a grouped bar chart or clustered bar chart is used to present the frequency distribution of two categorical variables. C is incorrect because a frequency polygon is used to display frequency distributions.
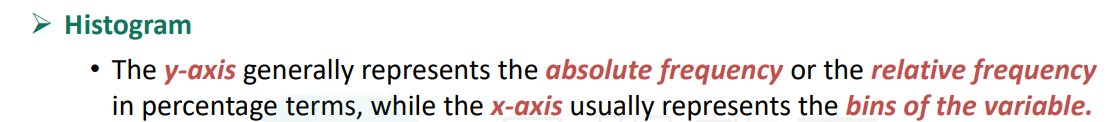
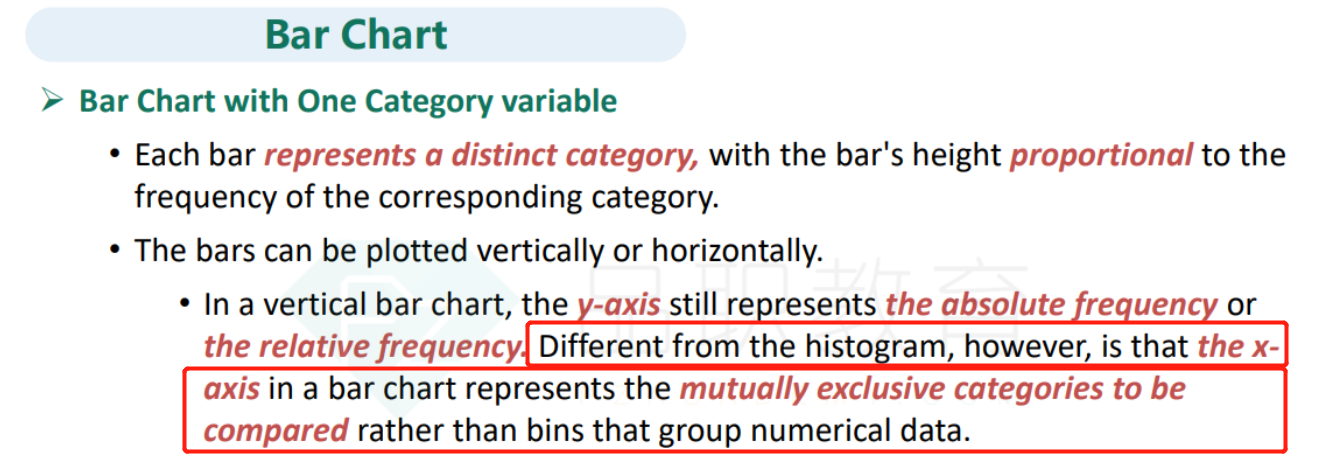
一定程度上来说,是不是histogram和bar chat是互等的。