Survivorship bias:
Description: Arise when a data series reflects only entities that have survived to the end of the period and excluded all failed entities.
Consequence: The analyst is likely overly optimistic in his projection. Return is overestimated and risk is underestimated.
appraisal [smoothed] data:
Description: For certain assets without liquid public markets, appraisal data are used in lieu of market price transaction data.
Consequence: Appraised values (interpolated data points) tend to be less volatile than market-determined values for the identical asset would be. (Risk is underestimated and risk-adjusted return is overestimated)
Nonstationarity (regime changes):
Description: Different parts of a data series reflect different underlying statistical properties. The risk that the data cover multiple regimes increases.
Consequence: Data of the previous period is probably not relevant for current economic analysis.
Data-mining bias
Description: The absence of an explicit economic rationale for a variable’s usefulness is one warning sign of a data-mining problem
Time-period bias
Description: Time-period bias relates to results that are time period specific. Research findings are often found to be sensitive to the selection of starting and/or ending dates.
Ex Post risk as a biased risk measure of Ex Ante risk
Description: The projections in the survey data tended to be more volatile than the actual outcomes over the same time period.
Consequence: This result indicates that the ex-post risk (i.e., the volatility of the actual data) tends to have a downward bias relative to the ex ante risk displayed by the survey data.

The Grinold–Kroner (GK) model is an extension of the Gordon growth model that takes explicit account of share repurchases.
The model also provides a means for analysts to incorporate expectations of valuation levels through the P/E ratio.
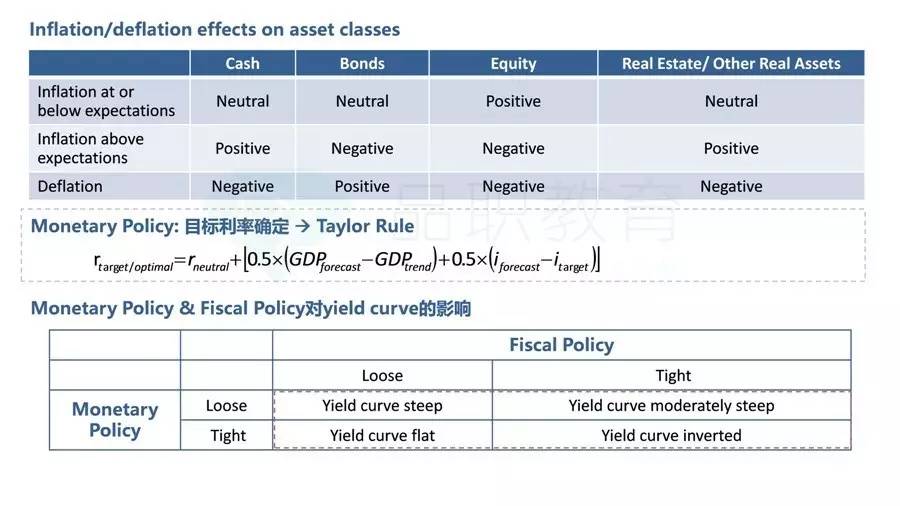
Taylor rule: Roptimal = Rneutral + [0.5 x (GDPgforecast – GDPgtrend) + 0.5 x (Iforecast – Itarget)]
current short-term interest rate > Roptimal, expansive monetary policy
current short-term interest rate < Roptimal, restrictive monetary policy


Purchasing Power Parity
PPP asserts that movements in an exchange rate should offset any difference in the inflation rates between two countries. The country with higher inflation will see its currency value decline.

Capital flows
Capital flows, measured by foreign direct investment, will decrease/increase the demand for the currency.
Relative economic strength
Favorable investment climate (for example, GDP increasing at a faster rate) will attract investors, which will increase the demand for a country’s currency and increase its value.
Savings-investment imbalances
If investment is greater than domestic savings, then capital must flow into the country from abroad to finance the investment.
In order to attract and keep the capital necessary to compensate for the savings deficit, the domestic currency must increase in value and stay strong.


Assume E1/P0=RT-Bond
The Fed model hypothesizes that, in equilibrium, the yield on long-term government bonds should be equal to the forward earnings yield on a broad equity index. Differences in these yields identify an overpriced or underpriced equity market.
缺点:
Ignore the equity risk premium: the assumption of Fed model is required return, and ROE for equity are equal to treasury bond yield;
Ignore earning growth opportunities.
Compares a real variable to a nominal variable.
Assume E1/P0=yB - d*LTEG
The Yardeni justified forward earnings yield = [10-year A-rated corporate bond yield – (Yardeni weighting factor x Projected long-term earnings growth rate)]. Stock market is undervalued if the forward earnings yield is higher than the Yardeni justified forward earnings yield.
优点(和Fed model对比):Two factors not included in the Fed Model but included in the Yardeni Model are
The equity risk premium. The Yardeni Model attempts to address the equity risk premium by including the yield on risky debt (credit spread on A-rated bonds). While including a credit risk premium may improve upon the Fed Model, this approach does not accurately address the equity risk premium.
Earnings growth. The Yardeni Model includes a long-term earnings growth forecast, which does accurately address the earnings growth.
缺点:
It incorporates a proxy for the equity market risk premium (the yield on A-rated corporate debt). The risk premium used is actually a measure of default risk, not a true measure of equity risk.
It relies on an estimate of the value investors place on earnings growth (d), which is assumed to be constant over time.
The growth rate used in the model (LTEG) might not be an accurate estimate of long-term sustainable growth.
优点:
it considers the effects of inflation
it captures the effects of business cycles
缺点:
it is backward-looking
It does not consider the effects of changes in accounting rules or methods
Empirical studies have found that very high or low P/10-year MA(E) ratios have persisted
Tobin’s q = (Market value of equity + Market value of debt) / Replacement cost of assets
Equity q = Market value of equity/(Replacement cost of assets - Market value of debt)
>1,资本市场贵àstock overvalued
<1,资本市场便宜àstock undervalued
缺点:
It is difficult to obtain an accurate measure of replacement cost for many assets
Evidence suggests that both low and high levels of Tobin's q and equity q can persist
首先说一下复习原则:
如果某一个章节计算比较多,一般需要记忆的考点就比较少,比如SS15,所以有些科目天然需要记忆的内容多,有些地方天然要记忆的地方少大家加油哦。

